 Ronald's solar powered microserver

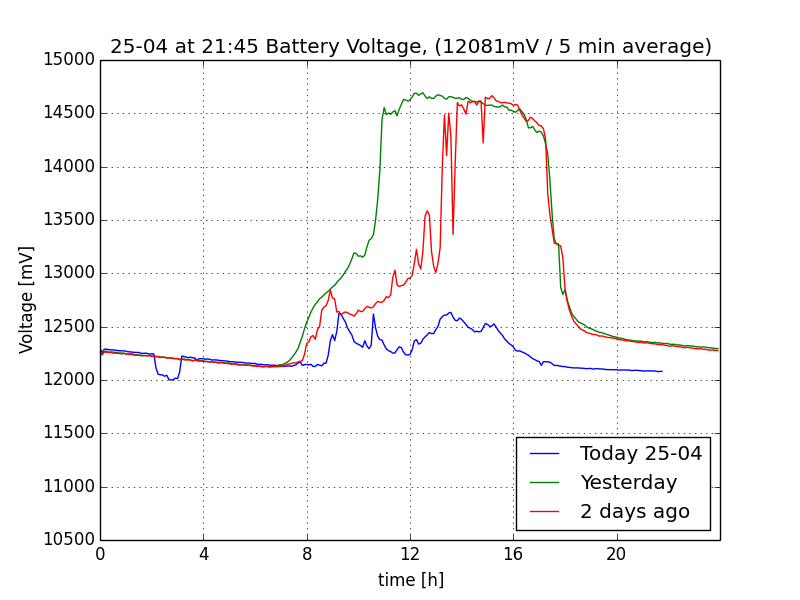
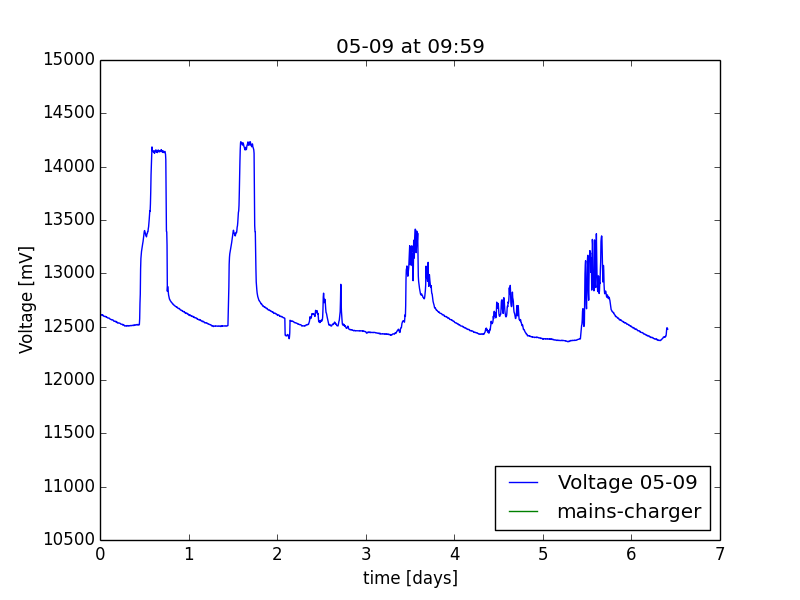
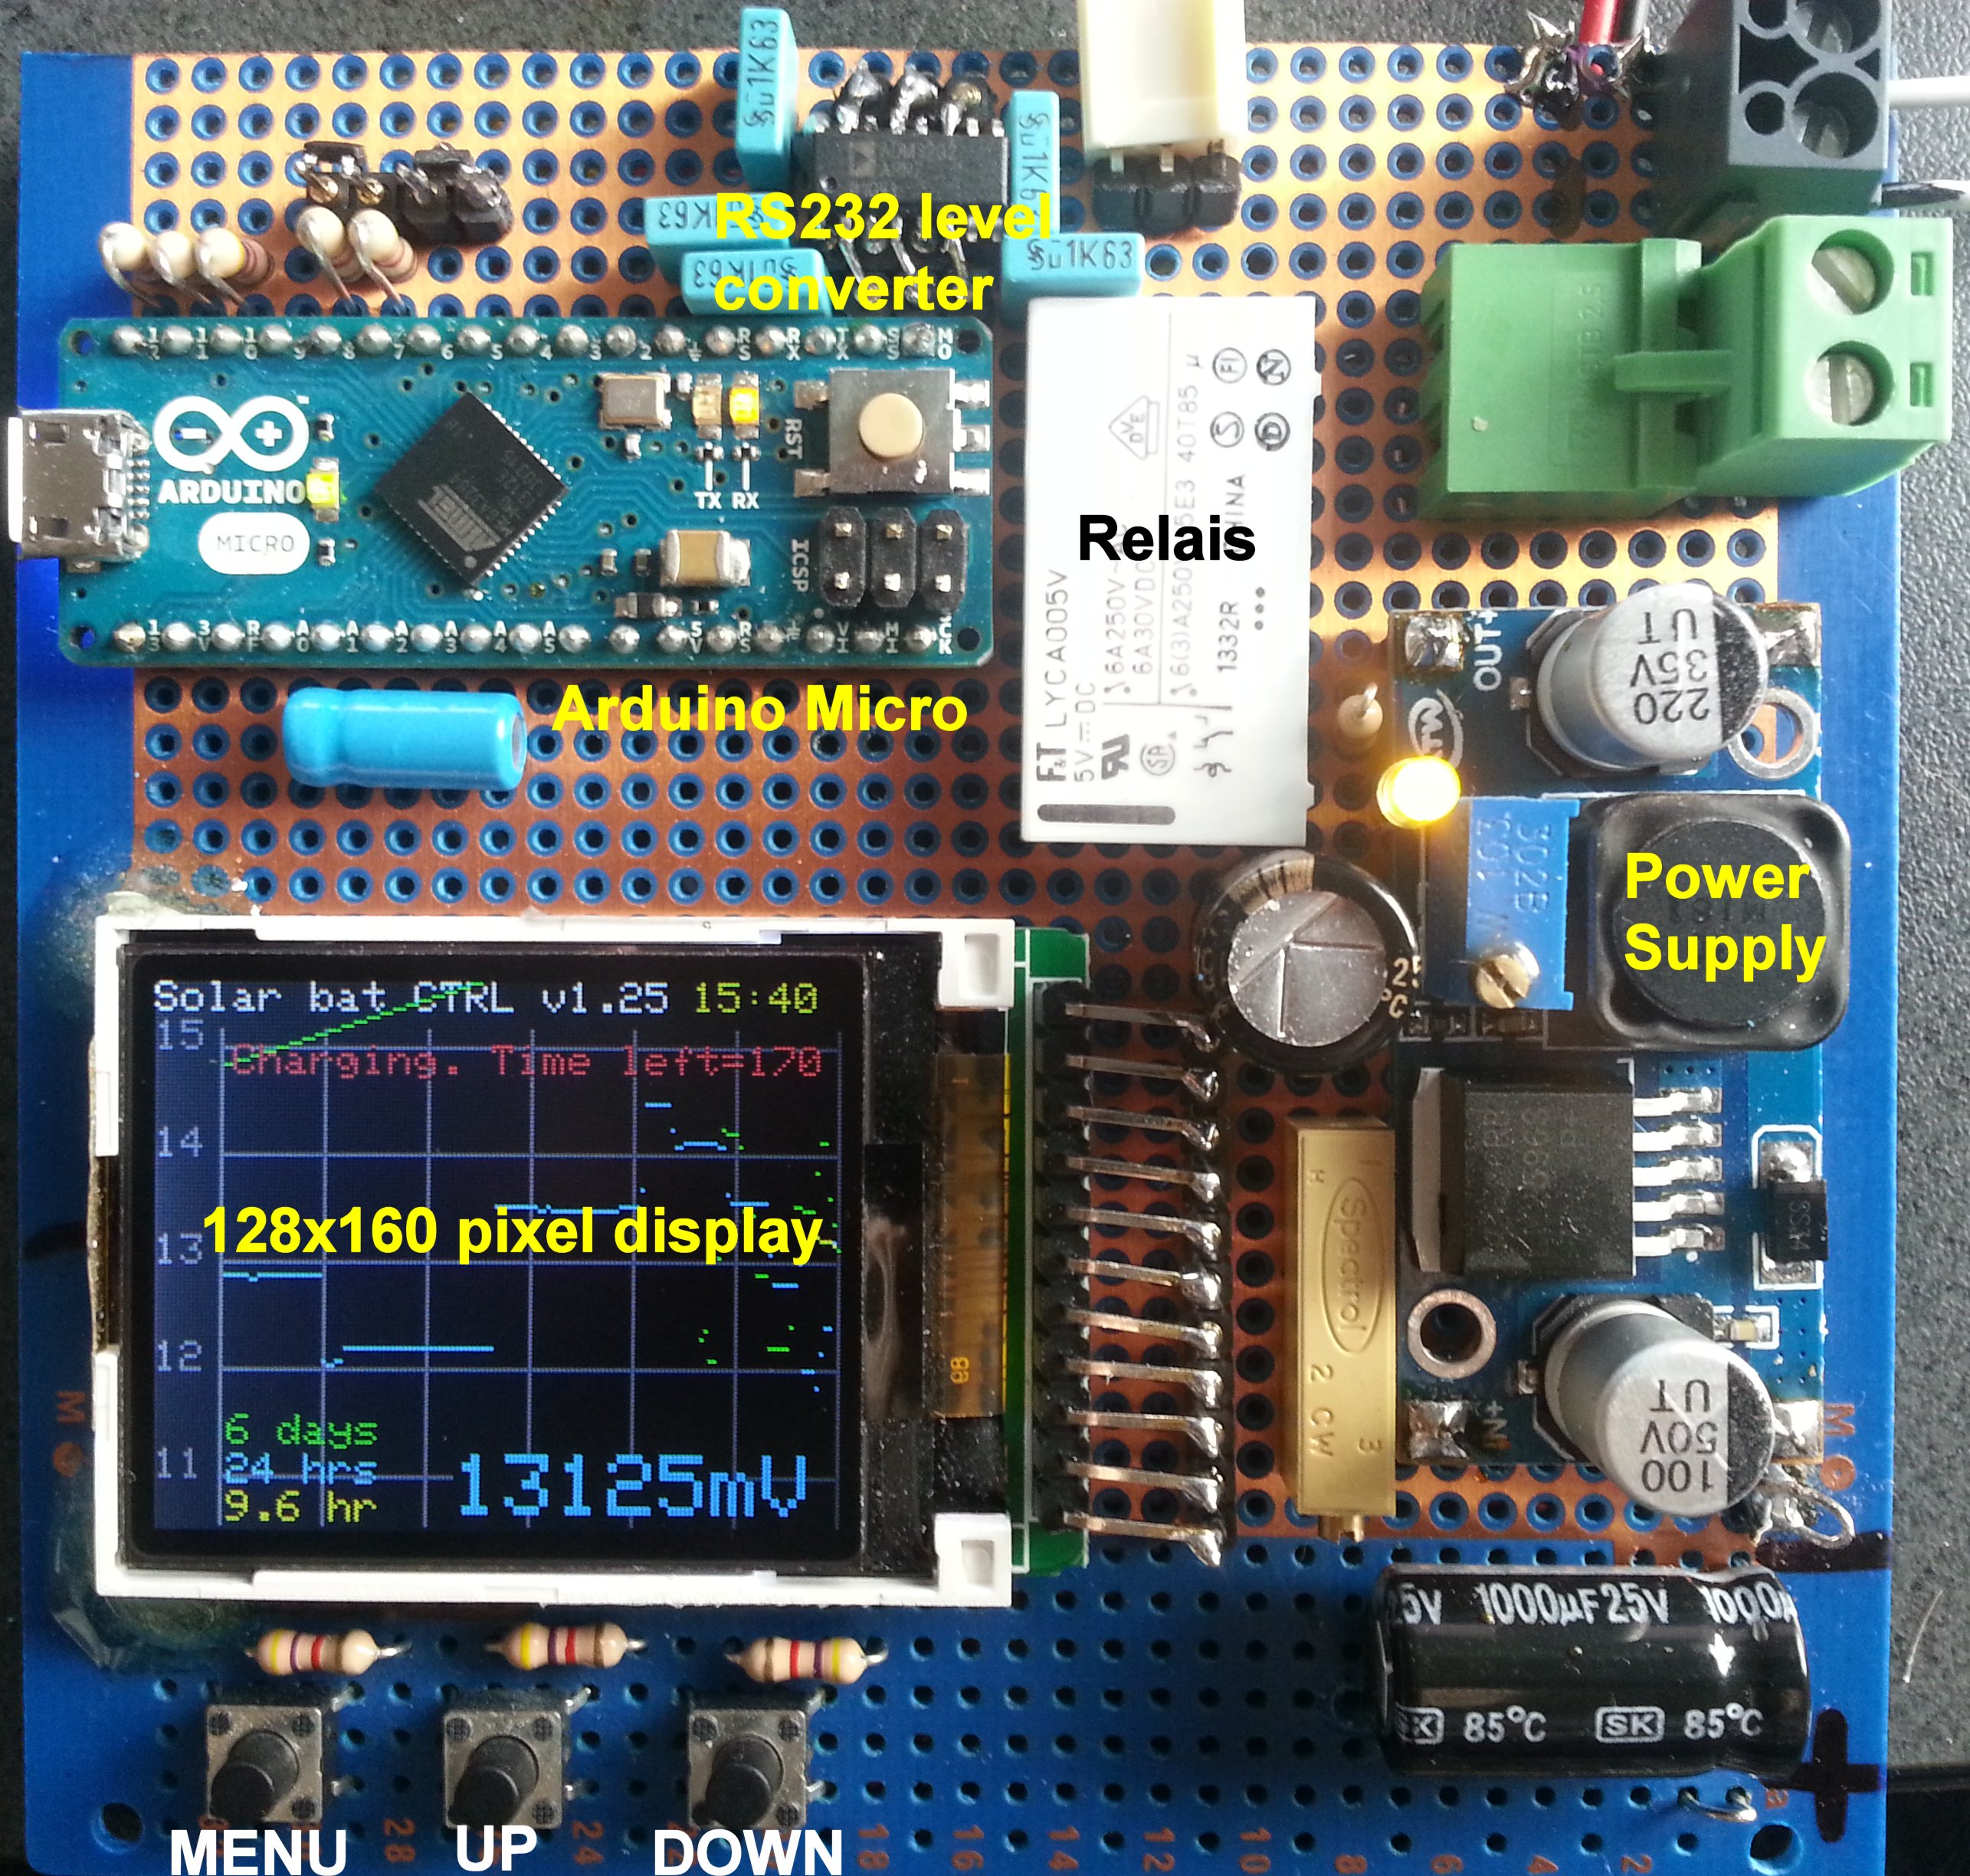
This wandboard Quad (32bit ARM) based microserver is solar powered thru a PV panel on my roof. There is a backup power source in case the lead-acid batteries get drained. This is controlled thru an Arduino that measures the battery voltage. It is connected to the Wandboard thru a serial connection to facilitate logging, shown in these plots:
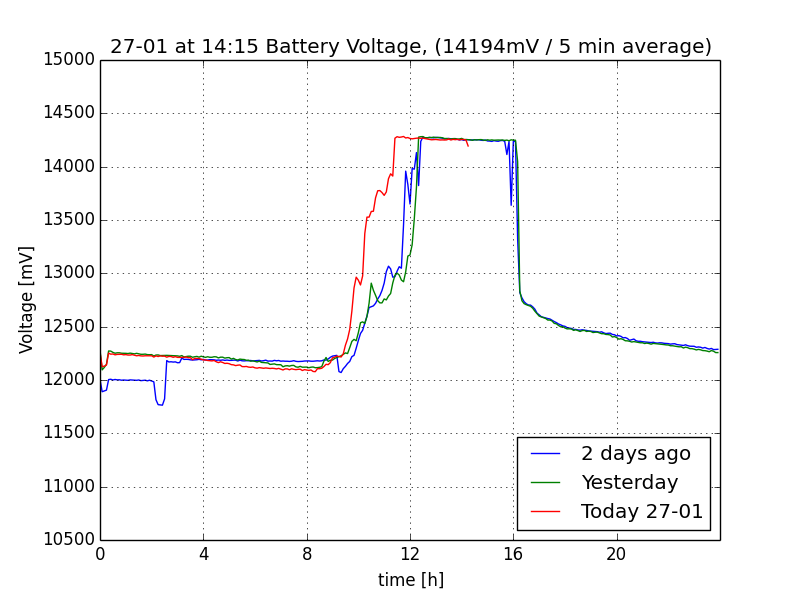 Voltage plot last 72 hours (one averaged sample every 5 mins) |
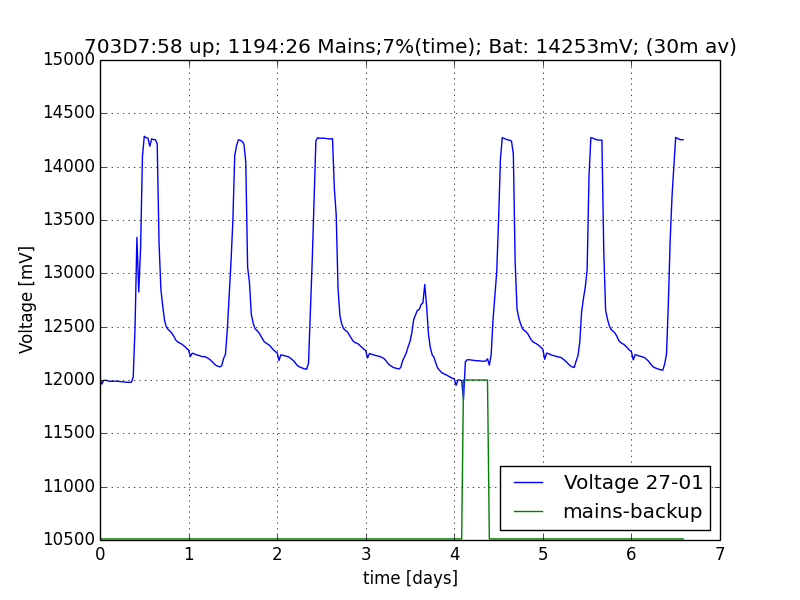 Voltage Plot last 7 days (one averaged sample every 30 mins) |
system setup change log:
-- 23Nov2013: Wandboard microserver webserving up
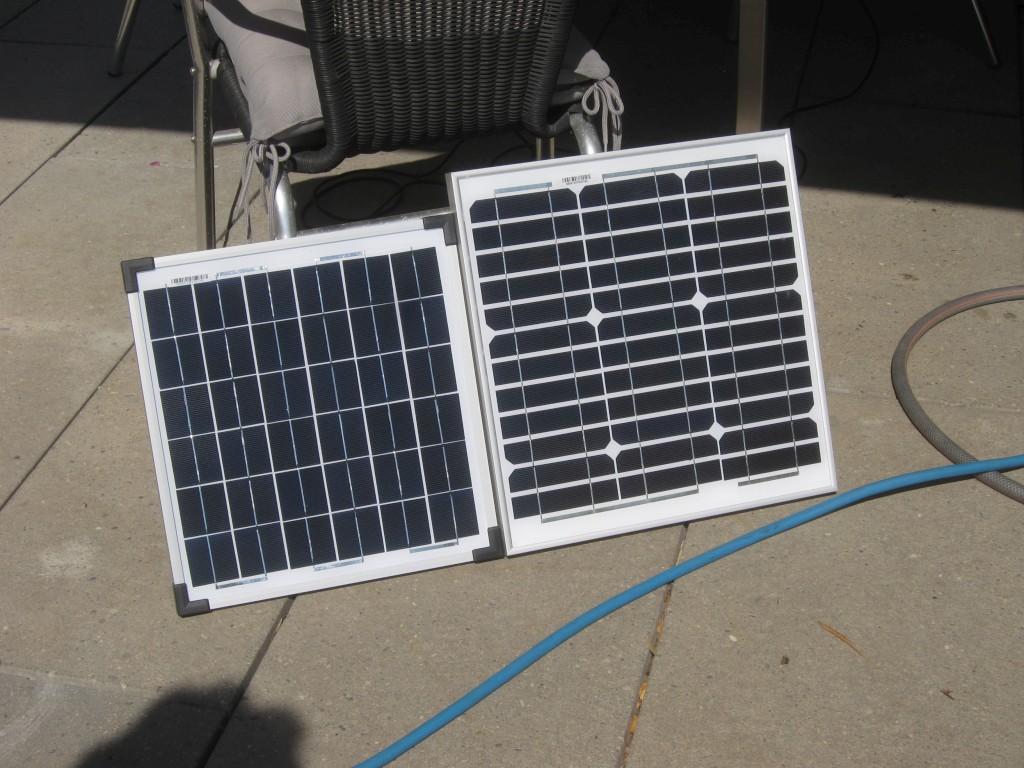
-- 27Sep2014: Switched to solar power source (two 20W panels with 2x 9Ah Gel lead-acid batteries)
-- 23Aug2015: gel battery replaced with 55AH car starter battery (AGM)
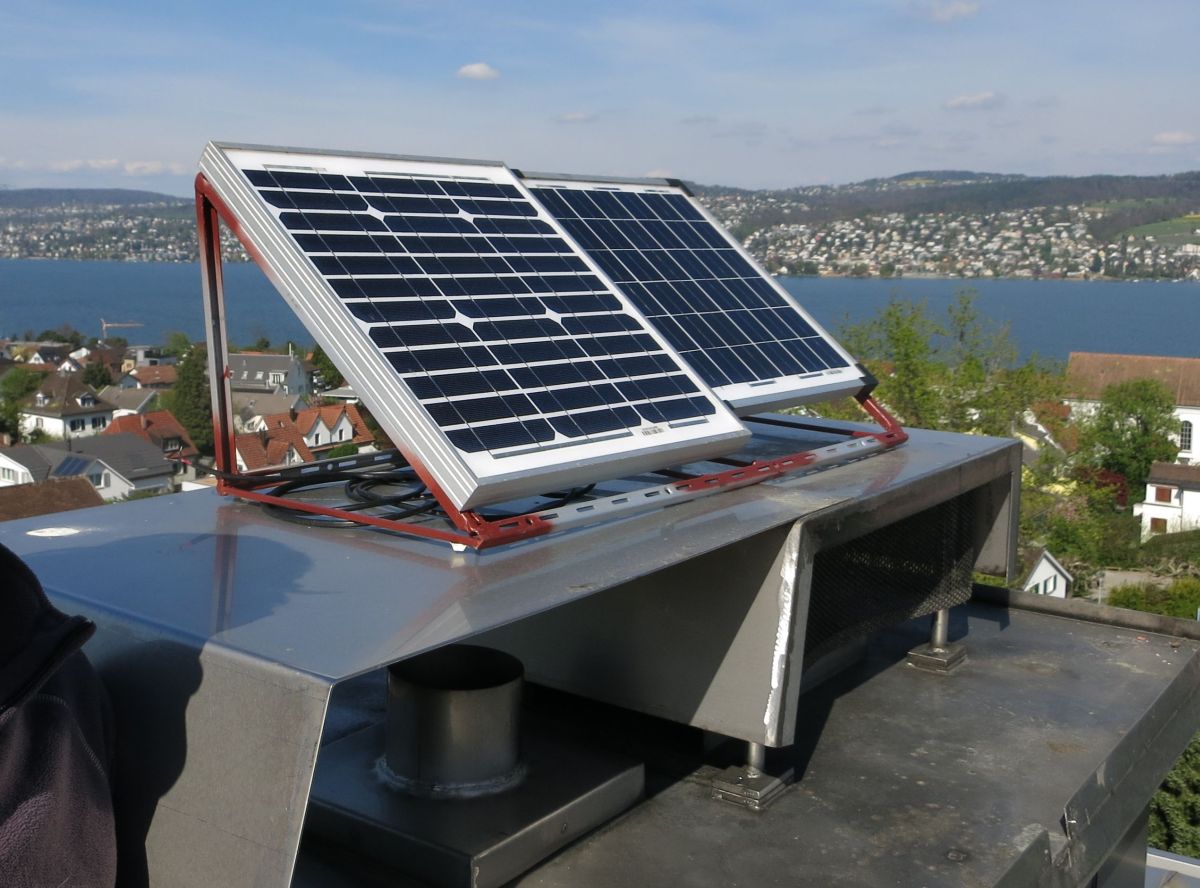
-- 12Apr2017: Panel moved to roof (avoid tree shadow), fixed at 45 degree angle pointing south
-- 13Apr2017: entire system (wandquad + SSD + Arduino controller + Solar charger/battery) moved to basement
-- 23Sep2017: added 5 year old 90Ah car battery (estimated 60Ah capacity left)
-- 01May2019: removed old 90Ah car battery (draining energy)
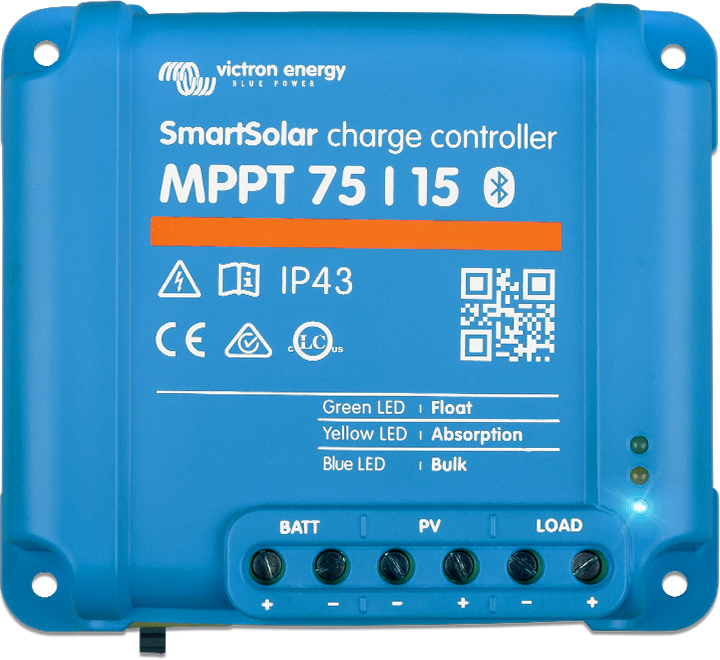
-- 01Nov2019: replaced PWM controller with Victron Energy SmartSolar MPPT 75/10
-- 02Nov2019: added new 44Ah car starter battery (AGM)
-- 10Nov2019: replaced Arduino Voltage logger with a new one (charger-->mains; use other serial port to Wandboard)
-- 24Nov2019: replaced old 2x20W panel with new 100W panel, angled at 30 degrees, pointing south
 |
Solar Trend controller - art.Nr. 03155 from www.sued-solar.de (website defunct) 12Vdc, power consumption: 4mA 120mm x 80mm x 25mm overload protection: 13.8 - 14.4V max load: 10A discharge protection: 11.1V Temp sensor for battery temp compensation |
 |
|
59153 page views since 28 Sept 2014.
--Apache/2.4.51 (Fedora) OpenSSL/1.1.1l on Ronald's Wandboard Quad, last page update 10 Nov 2019 @ 12:03
